Showing posts with label demonstration. Show all posts

March 7, 2019

DevOps with CloudCenter and Kubernetes in a multicloud environment

A short description of what is DevOps and how it helps companies to compete in their business with a faster innovation, followed by a demonstration of how the Cisco multicloud portfolio helps in the adoption of DevOps practices [see also this post for more detail].

If your time for reading is limited, here is the structure of the post: you can jump to the paragraphs you are interested in.

(The business view starts here)
The need for digital innovation.
  New services, better quality
  Frequent releases
DevOps is not a technology or a product.
  Cultural change and collaboration (break silos in the organization)
        Small teams responsible for a service’s lifecycle end to end
DevOps principles.
  Feedback loop
  CI/CD – Continuous Integration and Continuous Deployment

(The technical view starts here)
Cisco Multicloud approach.
Cisco CloudCenter Suite (CCS)
Cisco Container Platform (CCP)
Our lab
Application
Infrastructure
Demo flow
Implementation
Conclusions
DevOps makes it faster and easier
Cultural change is needed (incentives)
Cisco offers an effective toolset to help the adoption of DevOps practices


The need for digital innovation.

Whatever is your business, your customers expect more and more services, greater efficiency and value added by innovation.
Providing new business services (generally supported by software applications) to customers and anticipating your competitors’ moves attracts new customers and retains the existing ones. 
Often the lines of business are not satisfied with the support they receive from the corporate IT in terms of flexibility and speed to start a new project, especially if new technologies or skills are required (e.g. cloud native applications).
A better perceived quality of IT depends also on the frequency of the release of fixes for broken services and on the process to avoid that bugs reach the production environment, being intercepted in good functional and reliability tests.
Frequent releases and the quality of the code can benefit a lot from automation in all the phases of a software project, though the end to end automation is not absolutely necessary: it is just much better. The fundamental pillars are a good organization of the work and processes that ensure a coverage of every need (no gaps in the responsibility, no grey area in communication among different departments, shared objectives instead of finger pointing).

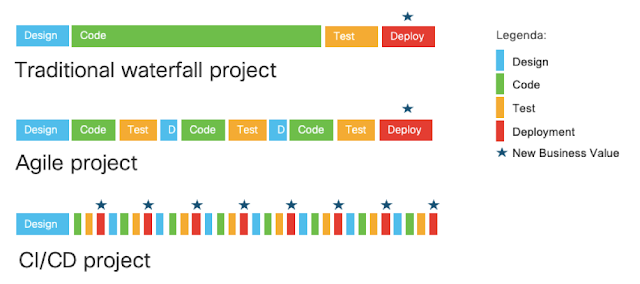
Next picture shows the evolution of methodologies and the impact on the value perceived by the business. The small star represents the instant when business value is realized by a release of the application in production.
With the traditional waterfall projects, it happens only at the end of the project (by the way, with a lot of uncertainty due to delays and unexpected troubles during the development and the test phases).
The agile methodology reduces the risk, repeating shorter cycles of design, coding and testing that can address any surprise and correct the course of the project sooner. But the deployment in production still happens at the very end of the project.
The innovation allowed by Continuous Integration and Continuous Deployment brings the application in production at every cycle (new releases or bug fixing) ensuring optimal quality and a deterministic outcome: the business will appreciate a benefit in terms of time to market for their initiatives.
CI/CD offers more business value
Picture 1 - CI/CD offers more business value


DevOps is not a technology or a product.

DevOps means collaboration between Developers and Operations.
The work of who is responsible for design and implementation of the code does not finish when a new build of the application is released. Developers should also collaborate in testing the system, releasing it in production, operating and measuring its KPI.
The Operation team should not just execute a defined process to maintain the system but should collaborate since the design phase of the application and, most importantly, provide a constructive feedback from the production environment that helps improving and extending the application in next development cycles.

The collaboration and the feedback loop are foundational principles in DevOps, as described in next paragraph. [See The DevOps Handbook: How to Create World-Class Agility, Reliability, and Security in Technology Organizations]

A cultural change. 

A cultural change (breaking silos in the organization) should be promoted, with incentives and gradual adoption of practices that will improve with time: the entire organization and the individuals have to digest a new way of working, openly analyze the outcome, contribute to the progress with personal feedback and suggestions. 
Everybody should feel that they have a common goal and they are collaborating to everyone’s success.
A great book describing this cultural change is the Phoenix Project.

Small teams responsible for a service’s lifecycle end to end.

DevOps practices suggest that the entire lifecycle of a service is managed by a single team: from the inception phase and the requirements analysis, to the implementation, test, release and operations. They can be more efficient – a provide a better quality – if they know everything about the service and they can react to any problem quickly, as well as evolving it based on new requirements.
The team should include representatives from different departments (lines of business, IT Architecture, Operations…) that bring their skill and experience, so a new organizational model can be required in your company: maybe a dotted line reporting structure with functional responsibilities.
It is not necessary to build a team for each service: some services can be grouped in one team, especially if they belong to the same business area or if they are the building blocks for a composite application (in a microservices architecture).

DevOps principles.

Gene Kim defines the principles that all of the DevOps patterns can be derived from (the Three Ways) in the books “DevOps Handbook” and “The Phoenix Project: A Novel About IT, DevOps, and Helping Your Business Win.” He asserts that the Three Ways describe the values and philosophies that frame the processes, procedures, practices of DevOps, as well as the prescriptive steps.

The First Way – Systems Thinking
•  Understand the entire flow of work
•  Seek to increase the flow of work
•  Stop problems early and often – Don’t let them flow downstream
•  Keep everyone thinking globally
•  Deeply understand your systems

First Way Goals
•  One source of truth – Code, environment and configuration in one place
•  Consistent release process – Automation is essential (one click)
•  Decrease cycle times, Faster release cadence

The Second Way – Feedback Loops
•  Understand and respond to the needs of all customers (internal and external)
•  Shorten and amplify all feedback loops
•  With feedback comes quality

Second Way Goals
•  Defects and performance issues fixed faster
•  Ops and InfoSec user stories appear as part of the application
•  Everyone is communicating better
•  More work getting done

The Third Way – Synergy
•  Consistent process and effective feedback result in agility
•  Now use that agility to experiment
•  You only learn from failure – So fail often, but recover quickly

Third Way Goals
•  Ability to anticipate, even define new business needs through visibility in the systems
•  Ability to test and optimize new business opportunities in the system while managing risk
•  Joy

Now that you have got an idea of what is DevOps, let’s have a look at a solution from Cisco that could make it easier to adopt DevOps practices. Remember that DevOps cannot be bought: it is the set of good practices that you define and refine based on continuous improvement based on direct experience. Automation is only a part of the story.


Cisco Multicloud approach.

Cisco knows that many customers are using at least one private or public cloud, but most of them use at least two: that implies a need for consistent governance, security, networking, analytics and automation that apply to every environment.
The multicloud portfolio includes products, and reference architectures to make the adoption simpler, that span all the technologies mentioned above.

This post explains how we have built a demo using products in the automation bucket to support a DevOps use case (i.e. Continuous Integration and Continuous Deployment, aka CI/CD).

The two products are the Cisco CloudCenter Suite (CCS) and the Cisco Container Platform (CCP), briefly described in the following paragraphs before we go to the demo.


Cisco CloudCenter Suite

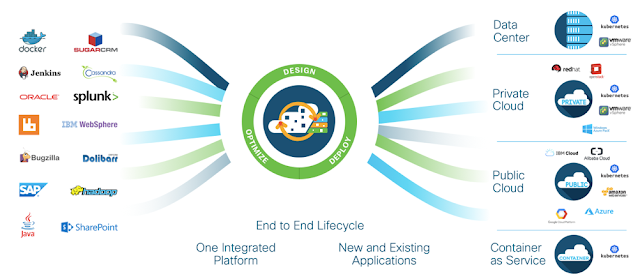
A solution to help the IT organization to sustain the pressure from developers and lines of business to deploy and operate a large number of applications and middleware platforms, made more complex by the availability of different possible targets (private and public clouds for running VM and containers).


CloudCenter addresses the many-to-many complexity
Picture 2 - CloudCenter addresses the many-to-many complexity


The CloudCenter Suite is a single tool to automate the deployments and broker resources from any cloud. It helps to enforce a single governance model including cost control, approval processes, security policies and consistent architecture across different clouds.
You don’t have to learn and use separate tools from the cloud providers, neither to replicate the automation blueprints using the native automation technologies in each cloud (e.g. Cloud Formation, Heat, Powershell): you only create a single model and CloudCenter translates it into call to the specific API exposed by each private and public cloud and Kubernetes clusters.
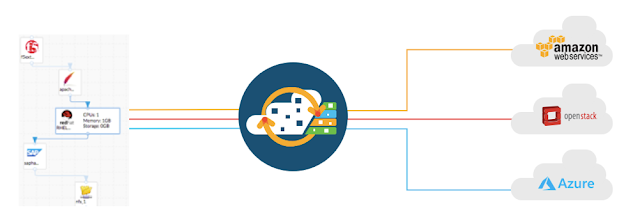


CloudCenter translates a single blueprint to API calls for all clouds
Picture 3 - CloudCenter translates a single blueprint to API calls for all clouds


Everything you do in CloudCenter can be done through its API, that makes it easy to orchestrate it externally (e.g. from Jenkins, through a plugin that Cisco ships so that you can insert multicloud deployments in your CI/CD pipeline).

The current version of the CloudCenter Suite also includes additional modules like the Cost Optimizer and the Action Orchestrator: a useful enhancement to create a governance model and make operations easy in a heterogeneous multi-cloud environment.


Cisco Container Platform

Another software product form Cisco, that you can see as a tool for Operations to create and manage enterprise grade Kubernetes clusters.
It creates, fully configures and manages (upgrades, scales, monitors) Kubernetes clusters on-premises and in the public cloud for you.
It takes care of all the complexity of the integration with networking (options offered out of the box are Calico, Contiv and Cisco ACI), storage, security (SSO and RBAC are added to Kubernetes) as well as centralized monitoring and logging while shipping 100% open source binaries from the upstream repositories.


Our lab

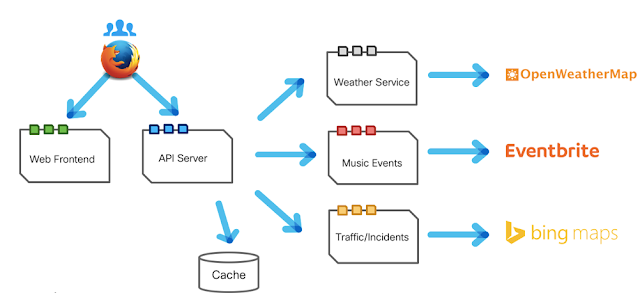
We have built a simple application based on a microservices architecture, as shown by the picture. 

the microservices application built for the demo
Picture 4 - the microservices application built for the demo

The source code of the 5 components is stored in a github repository, where new versions of the application are committed (saved) by developers. At each commit, the Jenkins orchestrator gets the source code and compiles it, building the container images ready to deploy the application.

The images are saved in a shared container registry (Harbor, see next picture) where Cisco CloudCenter will be able to retrieve them when asked by Jenkins to deploy the application. Based on input parameters provided by Jenkins, CloudCenter will target the deployment to the most appropriate environment for the current phase of the project.

In our demo lab, the environments are “integration test”, “performance test” and “production”.
They correspond to three different Kubernetes clusters that have been created in the private cloud (the first two) and in the public cloud (for the production environment).
Each environment has different policies set, that will be inherited by every application that is deployed there: for security, networking, autoscaling, etc.

The 3 Kubernetes clusters mentioned above have been generated by the Cisco Container Platform (though we could have created them manually in each cloud). The value in using CCP consists in consistent operations, speed and easiness: in few minutes we created 3 production-ready clusters, fully integrated with networking, storage, security, monitoring and logging without even touching the K8s installer or the underlying infrastructure.
The 2 clusters named “integration test” and “performance test” were created automatically inside VM in a local vmware environment, while the cluster named “production” was created in the Amazon cloud (CCP uses the API exposed by the Amazon EKS service to do everything automatically, including the integration with the AWS IAM for security).

The automated deployments will repeat, in the three environments, in a sequence that alternates them with the necessary tests and ensures the quality of the release. Though in the real world you might want to run more complex testing activities, this is a meaningful example of the efficiency you can achieve thanks to full automation of the process.
The pipeline can still be extended by adding additional tests like quality code inspection and more.
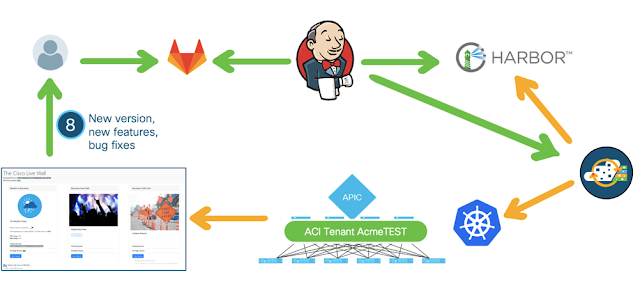

the CI/CD cycle
Picture 5 - the CI/CD cycle

Demo flow

Next picture is a sequence diagram showing all the actions that we have automated.
We used a color code to represent the phases that are commonly referred to as Continuous Integration (the green part) and Continuous Deployment (the orange part).
CCC stands for Cisco CloudCenter, where K8s dev, test and prod represent the 3 Kubernetes clusters mentioned above.
The entire process is completely automated and brings a new version of the application to the production deployment without any human intervention.
This complete automation is often referred to as Continuous Deployment and, though very useful and adopted by big players like Facebook (their pipeline is more complex than our simplified demo) is not very common among the customers I generally meet.
Those that adopted DevOps still prefer to have some human checks in between the activities, so that they feel they have a better control on the process and its quality.
When they have more experience, probably they will be confident enough to delegate every check to the automation tools.
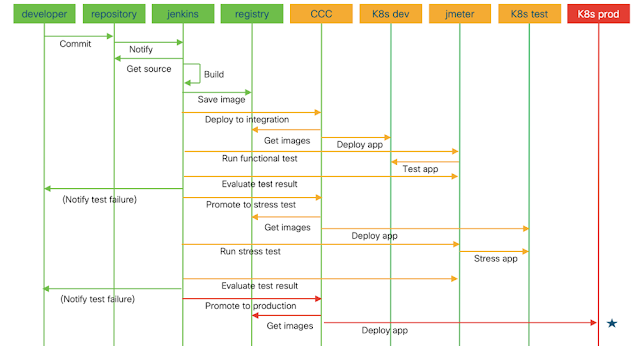

sequence diagram showing the automated actions
Picture 6 - a sequence diagram showing the automated actions


Implementation

The automation is based on Jenkins, an open source orchestrator that benefits from the availability of hundreds of plugins: it can automate almost every component in your IT ecosystem, including Cisco CloudCenter of course.

In the Jenkins dashboard you can build different projects, like in the picture below. A project is a sequence of steps, using plugins to drive activities in the systems you want to automate (e.g. pull the source code from the repository, compile it, build containers images, trigger a cloud deployment through CloudCenter, etc.).
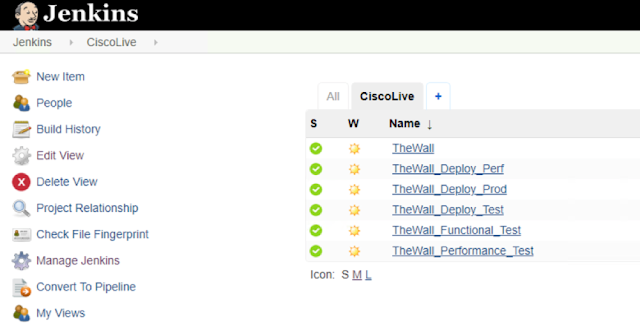
Jenkins projects
Picture 7 - Jenkins projects


Projects can call other projects, to make your orchestration modular and reusable. In the picture above, the project TheWall (that is the name of our demo application) calls the other 5 projects in a sequence, checking that the outcome is positive before calling next project.

So, we are able to automate the deployments in the 3 Kubernetes clusters and to run the functional test and the performance test of the application using an external tool (we used another open source product called Apache Jmeter). 

The functional test is a sequence of user transactions, executed by the test tool using a pool of user identities and a pool of input data, where assertions about the expected result are validated automatically. If the page generated by the application differs from the expected result, an error is logged, and the test can be considered failed. So, the functional test ensures that the application behaves as expected from a functional standpoint (and you can avoid a manual test for user acceptance).

The performance test, executed by the same tool, stresses the application and the infrastructure from a performance standpoint. A large number of concurrent users are simulated by the tool, invoking a sequence of user transactions with random wait time, reproducing a situation similar to the workload in a production environment. Response times are tracked and so are eventual errors, allowing the tool to declare that the test is successful or not.

Based on the outcome produced by Jmeter, the Jenkins orchestrator will continue with the Continuous Deployment pipeline or abort it, notifying the developers that something went wrong and a correction is required.
In this case, the CI/CD cycle will restart from the beginning: source code modified and committed, application built and deployed to the first environment, test executed, application promoted to next environment and tested… until the pipeline is completely executed without any warning or error and the application is released automatically in production.

Next picture shows the execution of the Jenkins pipeline for three different builds of the application. The most recent execution failed because the modification of the source code introduced an error that blocked the build. The other two executions succeeded, as demonstrated by the green color of every step in the pipeline.
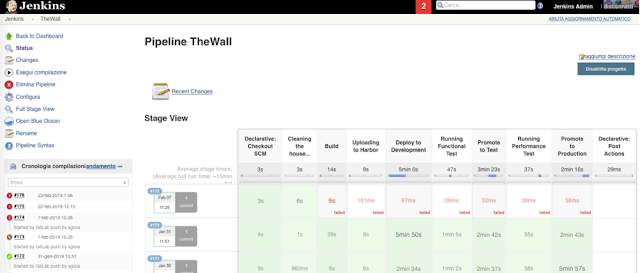
Jenkins pipeline
Picture 8 - Jenkins pipeline


Jenkins logs all the activities, so that you can check what’s happened during the automated process.
Next picture shows the output of the sub-project named TheWall_Deploy_Test, that is the 7th stage in the pipeline in previous picture.
It uses the API exposed by CloudCenter to deploy the application “TheWall” to a test environment running Kubernetes, that is robust enough to sustain the workload of the performance test (while the functional test can be executed also in a smaller cluster with less computing power).
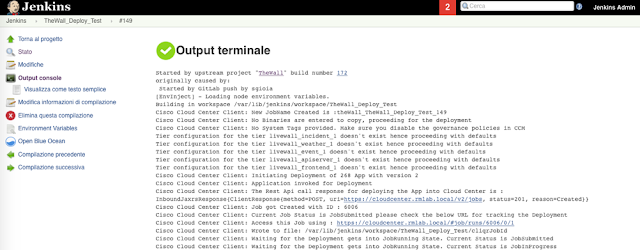

output from the Jenkins CI/CD pipeline
Picture 9 - output from the Jenkins CI/CD pipeline


You don’t have to code the API calls, because CloudCenter ships a plugin for Jenkins that integrates into its user interface graphically. But if you prefer, Jenkins can run scripts and commands from the CLI for you.

Conclusions

DevOps makes it faster and easier

If you adopt a DevOps methodology you bring agility to an extreme and get a business outcome from the fast release of applications. 

Cultural change is needed (use incentives)

DevOps is not a matter of technology. Your people need to work in a different way: no finger pointing between Developers and Operations, no “it’s not my job”, everybody should commit towards a common goal and enjoy their common achievement.
Initially it will be difficult, you have to teach them little by little. Offer incentives to people that shows a collaborative attitude and a spirit of innovation, let them feel like the heroes in the new adventure and grant that failures will not create any trouble. You learn from your mistakes and there is no magic wand to start directly with a perfect solution.
In addition, also traditional methodologies generate project failures: the difference is that DevOps anticipate problems and you discover them sooner, so the business impact is much smaller.

Cisco offers an effective toolset to help the adoption of DevOps practices

We all agree that DevOps is not a product. But once you start working you will see that automation helps the CI/CD process to be fluent. You can find great opens source (and free) tools – e.g. Jenkins, Jmeter, Ansible – to support your project teams, but if you also adopt Cisco CloudCenter and the Cisco Container Platform your professional life will be much easier.

Credits

The demo lab described in the post has been built with two colleagues and friends, that I want to thank here: Stefano Gioia and Riccardo Tortorici.

References

Jenkins – https://jenkins.io 


August 1, 2018

Lifecycle of an application in CloudCenter with CI/CD

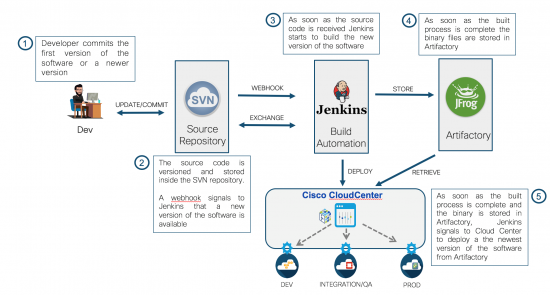
In a previous post we demonstrated how to automate the setup of a Continuous Integration / Continuous Deployment environment.

Now we will demonstrate how to use it: a developer can create an application that will be compiled, then built and deployed into a test environment automatically using this CI/CD toolset. 
Next picture shows the list of operations automated by the CI/CD.

Application deployment: sequence of automated operations
 Application deployment: sequence of automated operations


These are the lifecycle steps that we will demonstrate in this post:
1.    Deploy the PetClinic application (introduced in the previous post) automatically.
2.    Push the java source code to a repository (SVN).
3.    Creating the next release of the application by modifying the java source code and saving it as a new version in the repository.
4.    Watch the Jenkins orchestrator create the new build, save it in the binaries repository (Artifactory) and use CloudCenter to deploy it.

1 - Deploy the PetClinic application automatically. 

We start by deploying the Java application PetClinic, using the Application Profile created in CloudCenter, into our development environment in the lab. The correct behavior of the application is tested by accessing its home page and verifying that it shows correctly in the browser.

 2 - Push the java source code to a repository (SVN). 

We then push the java source code of the PetClinic application into the repository (SVN) that was created in our previous task, committing it as the initial release of the application.


Source code control: committing the java code into the SVN repository
Source code control: committing the java code into the SVN repository 


An automated build of the application and its deployment follow, as explained by the workflow above, thanks to the Jenkins orchestrator and CloudCenter.  If we access the Jenkins GUI (see next picture) through a web browser and we select the project “repo1” we can see that Jenkins is currently creating a new build: look at the progress bar. As soon as the building process is terminated the binaries are copied into the Artifactory repository of binary files and the Jenkins process called “deploy” starts.

Jenkins: following the build process
Jenkins: following the build process  


If we access the “deploy” job in Jenkins, we can see that a new build of the PetClinics application has been sent to CloudCenter to be deployed. This is made possible by the plugin that integrates Jenkins with Cloud Center.

Jenkins: deployment of the PetClinics application through CloudCenter


Cloud Center: viewing the deployment details of the deployed PetClinic application
Cloud Center: viewing the deployment details of the deployed PetClinic application 


PetClinic: home page of the deployed application


 3 - Creating next release of the application by modifying the java source code and saving it as a new version in the repository. 

Let’s assume now that another developer is working at improving the front end of the application and he is ready to commit a major chunk of code. For the sake of the demonstration we will only change the picture and the text on the homepage but we will show that, as soon as we commit the modifications to SVN, the new application is automatically deployed in the Development environment via Cloud Center (as you already know, the Development environment could be in any on-premises/hosted private or public cloud).

Application lifecycle: creating a new version of the code of PetClinic


We will modify the file petclinic/src/main/webapp/WEB-INF/jsp/welcome.jsp changing the text and the pet image (see next picture). Once we are done we save the new version of the file and commit it (right click, SVN Commit).  After waiting a few minutes for the whole chain of operation to finish, we will find out a new deployment of the application in Cloud Center –> Projects –> Project PetClinic  Now we can navigate the application, in the test environment, to see how the new release looks like: you can see that the puppy picture and the text message have been updated according to the edit done by the developer.

PetClinic: home page of the modified application

Conclusion  


The two use cases shown in this series of posts:
•    creation of a CI/CD environment as a service, and
•    automated Deployment of every new release of an application
demonstrate the power of CloudCenter as an orchestrator in deploying applications across a multicloud environment.

Every stage of the project (dev, test, prod…) can be associated to a different deployment environment, potentially in different clouds, having its own set of configuration, policies and rules. This information is stored in CloudCenter as part of the governance model you build for your IT.

The application will move automatically from one phase of the project to next one, if it passes the specific tests (i.e. integration, functional and performances tests, run by the automation tool) after each deployment.

In future posts we’ll show how to also automate these tests in a CI/CD pipeline. 
We will use open source tools like Apache Jmeter to run functional tests designed together with the application and automated by scripts stored in the same source code repository.
And we will run performance tests with the same tool, of course after CloudCenter has moved the deployment to a target environment that is able to sustain the load we generate.  

Credits 


This post is co-authored with a colleague of mine, Stefano Gioia.

References:

CloudCenter 

March 27, 2018

Why do you run slow, fragile and useless applications and are still happy?


If you are not interested in the detail, at least browse the post and watch the amazing video recordings embedded   :-)

We have already discussed the value of automation in the deployment of software applications.
It is also clear that collecting telemetry data from systems and applications into analytic platforms enhances visibility and control, with an important return on your business.

Cisco offers best of breed solutions for both automation and analytics, but the biggest value is in their  integration end to end. Your applications can be deployed with Cisco CloudCenter and completely controlled with AppDynamics and Tetration, with no manual intervention.

Why do you need that visibility?


Thanks to the information provided by AppDynamics, you have immediate visibility of the performances and the dependency map of your software applications. Tetration exposes its compliance and the performances from a system standpoint.
CloudCenter offers your users a self service catalog where applications can be selected for deployment in one of the clouds you have configured as a target: but the smartest feature is that every deployment can also install the sensors for AppDynamics and Tetration automatically in each node of the application topology, so that telemetry data start to be collected immediately.
why we need to collect information at runtime


With that, now you have no excuse to keep running applications that do not perform well enough, that expose vulnerabilities and that produce limited business return due to poor customer satisfaction or inefficiency. The same applies to non compliant applications that break your security rules or your architectural standards, that were deployed some years ago and now are untouchable due to complexity and lack of documentation.

With such an easy integration of telemetry and the insight that you can get immediately, it makes no sense keep those monsters running in your datacenter or in your cloud. You can evolve them and remove the bottlenecks and security risks once identified.


analytics tools add value to the application telemetry
Analytic tools add value to the application telemetry


We want to demonstrate how easy it is.

This post is a follow up to the demonstration of the integration of Cisco CloudCenter with Tetration: we extended the demo with the addition of AppDynamics, so that our applications are now completely under control when it comes to security, compliance, performances and business impact.

Architectural Overview


We used a well known application as an example: WordPress is an open source tool for website creation, written in php.  It uses a common LAMP stack: Apache + php + mySQL, running on Linux.
Wordpress is a two tier application, so you generally deploy two VM to run it: the front end is an Apache web server with the php application, the back end runs the database (mySQL).

We want that each tier is monitored, as a default, by both AppDynamics and Tetration. This must happen without introducing any complexity for the user that orders Wordpress from the self service catalog and must work in any target cloud. Based on the administrator preference, the user could even be unaware of the monitoring setup.


AppDynamics and Tetration integration with CloudCenter
Overview of the architecture


Next paragraphs describe the architecture of AppDynamics and of Tetration, so that you understand what integration we built to make CloudCenter inject telemetry sensors in each deployment. 
Then the process triggered when a user deploys Wordpress from the CloudCenter catalog is explained.
Detailed video recording of all the steps is also provided. 


AppDynamics: Architecture of the system


AppDynamics uses agents to collect information from the running servers and to send them to the controller. Agents are specific for the runtime of various programming languages, but there are also agents that interact only with the operating systems: you choose the type of agent that best fits each node. Also databases and their transactions can be monitored.
The Controller is where users go to view, understand, and analyze that data sent by agents.
Agents send data about usage metrics, code exceptions, error conditions and calls to backend systems to the Controller.

AppDynamics overview


CloudCenter: the Application Profile


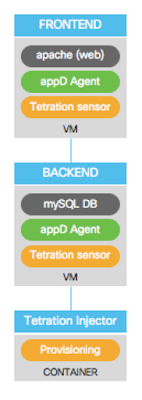
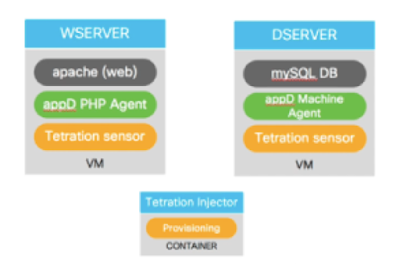
Next picture shows the Application Profile of the Wordpress service that we have created in CloudCenter. Each VM in the two tiers will contain the application and the required sensors for AppDynamics and Tetration. 

The Tetration injector component is an ephemeral Docker container that is used by CloudCenter just to invoke the API exposed by the Tetration cluster, so that the telemetry data are welcome when they arrive and associated to the scope of the Wordpress deployment. It disappears when the deployment is completed.

topology of the application deployment, showing the sensors applied
Topology of the application deployment, showing the sensors applied


As for any other application, the integration is implemented using custom scripts to deploy the agents for AppDynamics and Tetration
All application artifacts, scripts and services are stored in a Repository, and pulled by the CloudCenter agent running in each VM.
CloudCenter executes our scripts during different stages of the deployment, to add the AppDynamics Agent and the Tetration Sensor (using the same technique you could add any other agent that you use for backup, monitoring, etc.).
This is a video (2 min) showing how the Application Profile for Wordpress is built in CloudCenter:


CloudCenter integration with AppDynamics


The green boxes in next picture show the sequence of actions executed by the CloudCenter agent to deploy the AppDynamics php agent in the frontend VM: the same actions that the administrator would do manually.

installing and configuring AppDynamics agents
Installing and configuring AppDynamics agents


For your reference we used a shell script with placeholders, where configuration parameters are replaced by CloudCenter dynamically as listed below:

AGENT_LOCATION=“http://cc-repo.rmlab.local”
APPD_CONTROLLER="appd.rmlab.local”
APPD_CONTROLLER_PORT="8090”
APPD_ACCESS_KEY="a4abcdc7-ce1c-41cb-[cut]”
APPD_ACCOUNT_NAME="customer1”
APP_NAME="$parentJobName” ($parentJobName will be replaced by the value WPDEMO, that is the name given to the deployment by the user)
TIER_NAME="$cliqrAppTierName” ($cliqrAppTierName will be replaced by the value WSERVER, that is how the tier is identified in the Application Profile)
HOST_NAME="$cliqrNodeHostname" ($cliqrNodeHostname will be replaced by the value C3-b2a9-WPDEMO-WSER, generated by CloudCenter when it provisions the VM)

This video (2 min) shows how the existing Application Profile is updated adding the deployment of the AppDynamics agent:


Tetration: Architecture of the system


Tetration is a ready-to-use big data platform which runs a Hadoop cluster on its core.
As described in a previous post, Tetration collects telemetry streamed by software and hardware sensors. It stores metadata within the data lake and runs machine learning algorithms to provide business outcomes
Tetration sensors, downloaded from the cluster itself, embed the required configuration and don’t need any user input. As soon as they are installed, they start to stream rich telemetry and can optionally control local workload policy enforcement


Tetration overview
Tetration overview


CloudCenter integration with Tetration


At deployment time, a dropdown list allows the user to select one of the two types of sensor: Deep Visibility, or Deep Visibility with Enforcement (of security policies).

The telemetry data for this application are segregated under a specific scope, created by CloudCenter during the provision phase using the variable $parentJobName (containing the value WPDEMO in our demonstration).
The sensor are installed in each VM via a custom script, as described by next picture:


installing and configuring Tetration agents
installing and configuring Tetration agents


application VM with all the agents installed
Wordpress VM with all the agents installed

Next video (6 min) shows how a service (Tetration Injector) is created and then added to the existing Application Profile:


Result of the deployment seen in CloudCenter, Tetration and AppDynamics


This video shows the deployment of the Wordpress application from the CloudCenter self-service catalog.


And next video shows the analysis of telemetry data in Tetration, when the Wordpress application is deployed:


Finally, we look at AppDynamics to see the analysis of the behavior of the application from a business standpoint:


Summary 

Only Cisco can offer automated end-end, real-time application intelligence giving you 360 of visibility at business and network side Do you want to run this demo in your lab? Engage with us to setup a Lab.
All source code, the CloudCenter Services and the Application Profiles are available on github.

Credits and Disclaimer

This post describes a lab activity that was implemented by two colleagues of mine, Riccardo Tortorici and Stefano Gioia.
We created a demonstration lab to show our customers how easy it is to integrate the three products.
This is not the official documentation from Cisco about the integration, that will be released soon. 

References

Previous post on the integration of CloudCenter with Tetration: https://lucarelandini.blogspot.it/2017/10/turn-lights-on-in-your-automated.html


September 19, 2016

Infrastructure as Code with Terraform and Cisco Metapod


Recently I worked with a customer to explore the concept of Infrastructure as Code.
They like open source solutions for the automation of the infrastructure and for managing the software applications life cycle.
To reach the first objective their goal is a private cloud based on Openstack, while they will use Ansible and Terraform to manage the environments for different projects.

Managing the Infrastructure as Code means that the definition of the infrastructure is maintained in text files, that could be stored in a version control system like you do with the source code of the application.
If you do that, the same lifecycle applies to both the infrastructure and the application: creation of staging or production environments, automated testing, etc.
Using blueprints helps to improve the quality of the final result of the project and grants compliance with policies and eventual legal obligations.
Benefits include speed, cost savings (avoiding a static allocation of pre-provisioned resources) and risk reduction (removing errors and security violations).
Terraform is one of the best open source tools to manage your Infrastructure as Code: it’s easy to install, learn and use (one hour).
You could start from tutorials and free examples available on Internet.

Here is an example of full automation (we'll try to get a little better result):


As a first step, to make the usage of Openstack easier on a large scale, we discussed the value of a managed service.
If the IT organization could just focus their effort on the development and operations of the business applications, instead of running the infrastructure, they would create more value for the internal customers (company's lines of business).
So I proposed the adoption of Cisco Metapod, that is Openstack as a managed service (delegation of all the tough administrative and operational work to a specialized 3rd party, while you just use the Openstack user interface and API enjoying a SLA of 99.99% uptime). 
I have described the advantage of adopting Openstack as a managed service in this post: Why don't you try Openstack (without getting your hands dirty)? 
Services offered by Cisco Metapod around Openstack
Services offered by Cisco Metapod

We created a lab where Openstack abstracts the resources from the physical and virtual infrastructure (etherogeneous servers, network and storage) and the configuration of different environments is managed by Terraform, so that you can create, destroy, restore and update a complex system in few minutes.


Free to use Openstack for your apps, instead of managing it: focus on your real business

With Terraform you can describe the architecture in a declarative form (in a manifest file).
You simply describe what you need (the desired state), not how the different components (devices and software) must be configured with all their parameters and their specific syntax.
The goal of Terraform is to match the current state of the system with the desired state.


Desired State vs Current State


Terraform is used to create, manage, and manipulate infrastructure resources. Examples of resources include physical machines, VMs, network switches, containers, etc. Almost any infrastructure noun can be represented as a resource in Terraform. Terraform is agnostic to the underlying platforms by supporting providers. A provider is responsible for understanding API interactions and exposing resources. Providers generally are an IaaS (e.g. AWS, GCP, Microsoft Azure, OpenStack), PaaS (e.g. Heroku), or SaaS services (e.g. Atlas, DNSimple, CloudFlare). 

Infrastructure as Code


Desired State

In my lab I reused a good example that I found on GitHub at https://github.com/berendt/terraform-configurations 
It contains all the resources you need to deploy a new Devstack instance (a all-in-one instance of Openstack, useful for developers) including the needed networks, public addresses, firewall rules on a target cloud platform. That, incidentally, is a Openstack instance (so we are deploying Openstack on Openstack).

Here is the content of the main.tf file used by Terraform: it references variables with the format ${variable_name}, including the output from actions on other resources. Dependencies between resources are managed automatically by Terraform. A separate file can contain the predefined values for your variables (like the references to the Openstack lab in my example).

If you are not interested in the content of this file (I guess it applies to 70% of my readers) you can skip it and go to next picture... there is also a good recorded demo down there   :-)


main.tf (the manifest file where Terraform ready the desired state of all the resources):

provider "openstack" {
  user_name  = "${var.user_name}"
  tenant_name = "${var.tenant_name}"
  password  = "${var.password}"
  auth_url  = "${var.auth_url}"
}

resource "openstack_networking_network_v2" "terraform" {
  name = "terraform"
  region = "${var.region}"
  admin_state_up = "true"
}

resource "openstack_compute_keypair_v2" "terraform" {
  name = "SSH keypair for Terraform instances"
  region = "${var.region}"
  public_key = "${file("${var.ssh_key_file}.pub")}"
}

resource "openstack_networking_subnet_v2" "terraform" {
  name = "terraform"
  region = "${var.region}"
  network_id = "${openstack_networking_network_v2.terraform.id}"
  cidr = "192.168.50.0/24"
  ip_version = 4
  enable_dhcp = "true"
  dns_nameservers = ["208.67.222.222","208.67.220.220"]
}

resource "openstack_networking_router_v2" "terraform" {
  name = "terraform"
  region = "${var.region}"
  admin_state_up = "true"
  external_gateway = "${var.external_gateway}"
}

resource "openstack_networking_router_interface_v2" "terraform" {
  region = "${var.region}"
  router_id = "${openstack_networking_router_v2.terraform.id}"
  subnet_id = "${openstack_networking_subnet_v2.terraform.id}"
}

resource "openstack_compute_secgroup_v2" "terraform" {
  name = "terraform"
  region = "${var.region}"
  description = "Security group for the Terraform instances"
  rule {
    from_port = 1
    to_port = 65535
    ip_protocol = "tcp"
    cidr = "0.0.0.0/0"
  }
  rule {
    from_port = 1
    to_port = 65535
    ip_protocol = "udp"
    cidr = "0.0.0.0/0"
  }
  rule {
    ip_protocol = "icmp"
    from_port = "-1"
    to_port = "-1"
    cidr = "0.0.0.0/0"
  }
}

resource "openstack_compute_instance_v2" "terraform" {
  name = "terraform"
  region = "${var.region}"
  image_name = "${var.image}"
  flavor_name = "${var.flavor}"
  key_pair = "${openstack_compute_keypair_v2.terraform.name}"
  security_groups = [ "${openstack_compute_secgroup_v2.terraform.name}" ]
  floating_ip = "184.94.252.189"

  network {
    uuid = "${openstack_networking_network_v2.terraform.id}"
  }

  provisioner "remote-exec" {
    script = "deploy.sh"
    connection {
      user = "${var.ssh_user_name}"
      key_file = "${var.ssh_key_file}"
    }
  }
}


To make it simple, for this blog post I replaced the part that deploys Devstack with a simpler setup of a web server (Apache).

deploy.sh (Terraform will copy and execute it on the remote instance as soon as it is created):

#!/bin/bash

# author: Joe Topjian (@jtopjian)
# source: https://gist.github.com/jtopjian/4ffc82bfcbbcc78d07e4

sudo apt-get update
sudo apt-get install -y -f apache2


The goal is to demonstrate how easy it is to create a new software environment on a Cisco Metapod Openstack target from scratch and run it. 
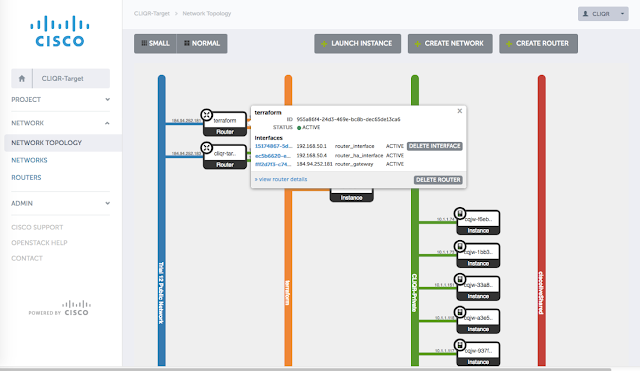
The following pictures show the Metapod console before and after running the "terraform apply” command on my computer.

This is before I run the command:

The Openstack console from Cisco Metapod: view of the tenant networks
The Openstack console from Cisco Metapod

And this is the expected result (network and server infrastructure created, apache installed):

Terraform has created all the required resources in Openstack
Resources created in Openstack

Next video (the most important part of this post) is a recorded demonstration of the creation of the new Apache server: you can see the launch of the “terraform apply” command that, after reading the manifest file, creates a network, a subnet, a router with two interfaces, a floating ip and a instance on Openstack. Then the Apache web server is downloaded and installed in the new instance.
The Metapod console is left in the background and you see the Openstack objects pop up as they are created.
Finally the home page of the new web server is tested.


Conclusion

It is very easy to get rid of the delays, the misunderstandings and the inefficiency of many current IT organizations.
If you standardize the process that developers follow to obtain the environment for a new project - in all the phases of the life cycle - you can enable a faster go to market for new business initiatives making your customers happy.
It would be a first step towards DevOps (more is required, mostly in changing the culture of both developers and people in operations).

Infrastructure as code is a brilliant way to create the needed infrastructure on demand (and release it when no longer needed), to maintain it based on blueprints and manage the definition of the infrastructure with the same tools you use for the application source code: a text editor (or your preferred IDE), a version control system, an automation tool.

If you have a IaaS platform like Openstack, provisioning of both virtual and physical resources is made easy.
If you do a further step forward with a managed service, someone will grant that your Openstack is correctly configured for production, up to date and in perfect health. You enjoy all the benefits, without the hassle of setting it up and operating it daily.


References:
Configuration to run acceptance tests for Terraform/OpenStack - https://github.com/berendt/terraform-configurations
Why don't you try Openstack (without getting your hands dirty)? - http://lucarelandini.blogspot.it/2016/06/why-dont-you-try-openstack.html